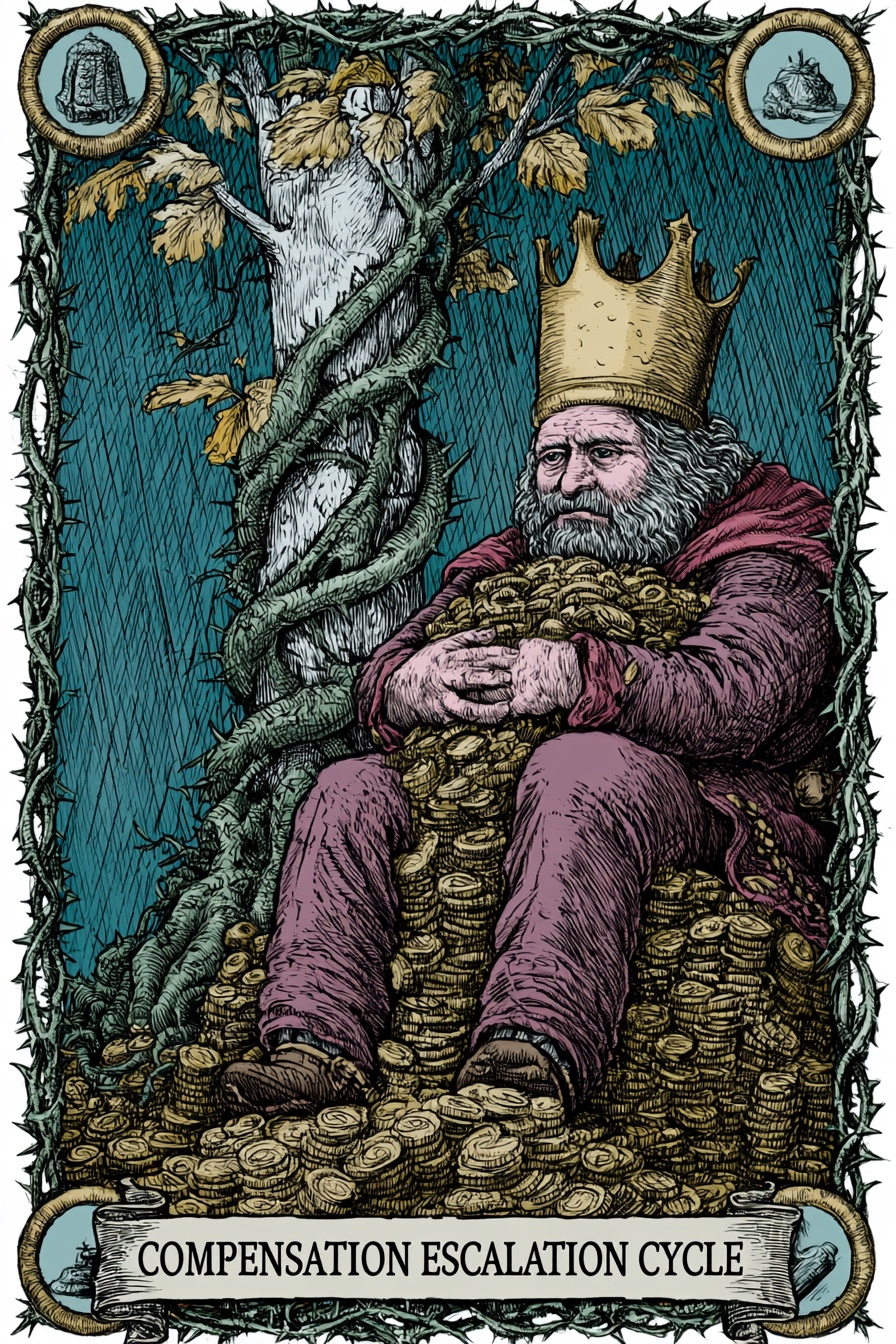
Compensation Escalation Cycle
"Serves as the central hub for elevating and promoting all arts and cultural activities in the Telluride region, providing comprehensive support for artists and broad access for the community and visitors."
— Statement of Program Service Accomplishments
What does this mean?
Revenue grows modestly, but top officer compensation grows consistently for 5 years, breaching danger zones. The executive is negotiating aggressive raises against a compliant board.
The Path Forward
The Steward
Re-establishes board supremacy over executive extraction. It freezes compensation and mandates that all future financial rewards be tied strictly to verifiable mission expansion.
Demonstrated Impact
- 25 galleries participated in summer and winter gallery guides
- 10 First-Thursday Art Walks hosted
Title
Representative Institutions
Institutional Epochs
Historical Performance
| Year | Revenue | Top Comp | Comp % Rev | Score | Phase Label | Outlook | Details |
|---|---|---|---|---|---|---|---|
| 2024 | Hidden | Hidden | — | — | Unknown | — | |
| 2023 | Hidden | Hidden | 13.1% | 48 | Fragile | Decline Risk | |
| 2022 | Hidden | Hidden | 3.3% | 55 | Fragile | Stable Watch | |
| 2021 | Hidden | Hidden | 6.1% | 54 | Fragile | Recovery | |
| 2020 | — | — | 13.4% | 51 | Fragile | Gov Risk | |
| 2019 | — | — | 4.8% | 55 | Fragile | Recovery | |
| 2018 | — | — | 11.3% | 46 | Fragile | Decline Risk | |
| 2017 | — | — | — | 48 | Fragile | Recovery | |
| 2016 | — | — | — | 32 | Critical Intervention Needed | Stable Watch | |
| 2015 | — | — | — | 29 | Critical Intervention Needed | Stable Watch | |
| 2014 | — | — | — | 29 | Critical Intervention Needed | Decline Risk | |
| 2013 | — | — | — | 35 | Critical Intervention Needed | Stable Watch | |
| 2012 | — | — | — | 35 | Critical Intervention Needed | Recovery | |
| 2011 | — | — | — | 29 | Critical Intervention Needed | Decline Risk | |
| 2010 | — | — | — | 33 | Critical Intervention Needed | Stable Watch |
Officer compensation history
Tax year 2025
| Name | Title | Phone | Compensation | |
|---|---|---|---|---|
| KATE JONES | Executive Director | 14.7% of Rev | ||
| KATE JONES | Executive Director | 13.0% of Rev | ||
| KATE JONES | Executive Director | 10.0% of Rev | ||
| BASIT MUSTAFA | Board President | — | ||
| EDWARD A POWELL JR | Board President | — | ||
| CHRIS HARDEN | Treasurer | — | ||
| TESS PETERS | Secretary | — | ||
| MICHELINE KLAGSBRUN | Secretary | — | ||
| DOUGLAS BRADBURY | Board Member | — | ||
| TODD BROWN | Board Member | — | ||
| DIANA FARRELL | Board Member | — | ||
| ASHLEY HAYWARD | Board Member | — | ||
| Executive Director | — | |||
| PENELOPE P GLEASON | Board President | — | ||
| CHRIS HARDEN | Treasurer | — | ||
| BASIT MUSTAFA | Board President | — | ||
| TESS PETERS | Secretary | — | ||
| TODD BROWN | Board Member | — | ||
| DOUGLAS BRADBURY | Board Member | — | ||
| MICHELINE KLAGSBRUN | Board Member | — | ||
| SEAN MAHONEY | Board Member | — | ||
| CHRISTOPHER HO | Board Member | — | ||
| SHASHEEN SHAH | Board Member | — | ||
| KEN MERIDETH | Board Member | — | ||
| BASIT MUSTAFA | Board President | — | ||
| PENELOPE P GLEASON | Board President | — | ||
| CHRIS HARDEN | Treasurer | — | ||
| TESS PETERS | Secretary | — | ||
| TODD BROWN | Board Member | — | ||
| DOUGLAS BRADBURY | Board Member | — | ||
| ASHLEY HAYWARD | Board Member | — | ||
| MICHELINE KLAGSBRUN | Board Member | — | ||
| EDWARD A POWELL JR | Board Member | — | ||
| SEAN MAHONEY | Board Member | — | ||
| CHRISTOPHER HO | Board Member | — | ||
| SHASHEEN SHAH | Board Member | — | ||
| KEN MERIDETH | Board Member | — |
Tax year 2023
| Name | Title | Phone | Compensation | |
|---|---|---|---|---|
| KATE JONES | Executive Director | 10.0% of Rev | ||
| PENELOPE P GLEASON | Board President | — | ||
| CHRIS HARDEN | Treasurer | — | ||
| BASIT MUSTAFA | Board President | — | ||
| TESS PETERS | Secretary | — | ||
| TODD BROWN | Board Member | — | ||
| DOUGLAS BRADBURY | Board Member | — | ||
| MICHELINE KLAGSBRUN | Board Member | — | ||
| SEAN MAHONEY | Board Member | — | ||
| CHRISTOPHER HO | Board Member | — | ||
| SHASHEEN SHAH | Board Member | — | ||
| KEN MERIDETH | Board Member | — |
Tax year 2021
| Name | Title | Phone | Compensation | |
|---|---|---|---|---|
| KATE JONES | Executive Director | 7.6% of Rev | ||
| KEN MERIDETH | Board Member | — | ||
| ERIC CUMMINGS | Board Member | — | ||
| SEAN MAHONEY | Board Member | — | ||
| CHRISTOPHER HO | Board Member | — | ||
| MICHELINE KLAGSBRUN | Board Member | — | ||
| CHRIS HARDEN | Board President | — | ||
| PENELOPE GLEASON | Board President | — | ||
| TODD BROWN | Treasurer | — | ||
| DOUGLAS BRADBURY | Board Member | — | ||
| LESLIE TRUDEAU | Secretary | — |
Score breakdown
The three components combine into a single 0–100 score weighted as shown. Full methodology →
Peer comparison
Compared to 271 other orgs in CO with NTEE prefix A6.
Most-divergent component: program score sits 28 points above the peer median (60 vs. 32).
5-year trend: Compensation Escalation Cycle
Revenue grows modestly, but top officer compensation grows consistently for 5 years, breaching danger zones. The executive is negotiating aggressive raises against a compliant board.
What's driving this score
- Comp-to-revenue ratio of 13.1% sits within the sector's healthy band (18–22%).
What would change this score
No specific high-impact levers identified — this org's score is balanced across components.
Improving governance is a board decision. These are the levers.