
Acute Resource Divergence
What does this mean?
Revenue is contracting significantly, but executive compensation percentage is rising. The organization is refusing to adjust its administrative overhead to match its new economic reality.
The Path Forward
The Realignment
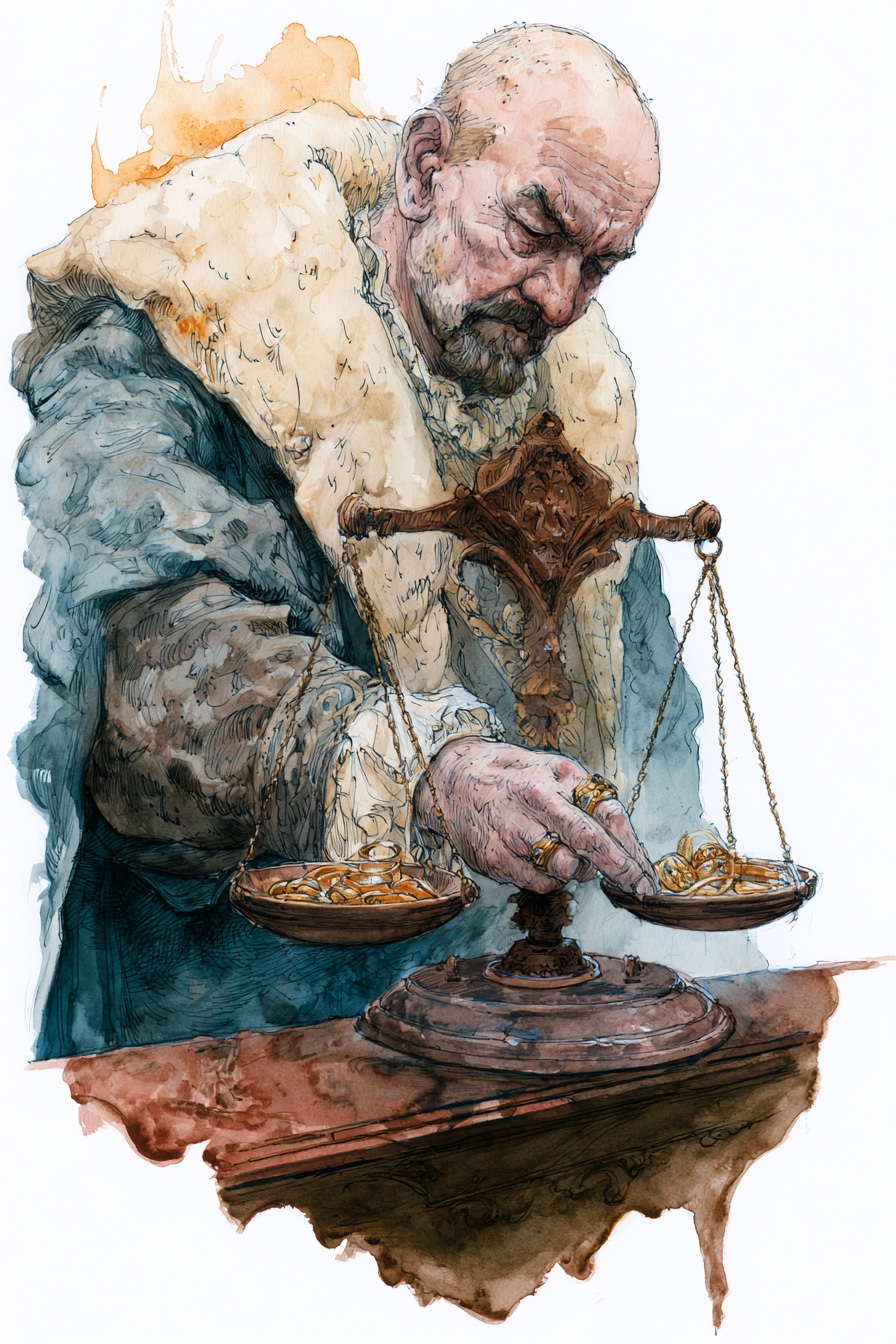
Forces immediate balancing of administrative bloat against actual programmatic output. It demands that every dollar extracted for overhead be justified by community impact.
Title
Representative Institutions
Institutional Epochs
Historical Performance
| Year | Revenue | Top Comp | Comp % Rev | Score | Phase Label | Outlook | Details |
|---|---|---|---|---|---|---|---|
| 2025 | Hidden | Hidden | — | — | Unknown | — | |
| 2023 | — | — | 11.7% | 38 | Financially Distressed | Decline Risk | |
| 2022 | — | — | 5.0% | 51 | Fragile | Decline Risk | |
| 2021 | — | — | 8.1% | 54 | Fragile | Recovery | |
| 2020 | — | — | 8.7% | 44 | Fragile | Recovery | |
| 2019 | — | — | 9.2% | 38 | Financially Distressed | Decline Risk | |
| 2018 | — | — | 4.5% | 43 | Fragile | Recovery | |
| 2017 | — | — | 6.3% | 34 | Critical Intervention Needed | Decline Risk | |
| 2016 | — | — | 7.2% | 36 | Financially Distressed | Recovery | |
| 2015 | — | — | 5.8% | 34 | Critical Intervention Needed | Decline Risk | |
| 2014 | — | — | 7.4% | 34 | Critical Intervention Needed | Decline Risk | |
| 2013 | — | — | 7.4% | 38 | Financially Distressed | Recovery | |
| 2012 | — | — | 7.7% | 34 | Critical Intervention Needed | Stable Watch | |
| 2011 | — | — | 9.2% | 34 | Critical Intervention Needed | Stable Watch |
Officer compensation history
Tax year 2026
| Name | Title | Phone | Compensation | |
|---|---|---|---|---|
| ROBERT MASSEY | Executive Director | 7.2% of Rev | ||
| BECK ENGWERDA | Board Member | 4.6% of Rev | ||
| NANCY JOHNSON | Board President | — | ||
| NICHOLAS ADAMS | Board President | — | ||
| JAMES WILLIAMS | Treasurer | — | ||
| SARALYN WINSLOW | Secretary | — | ||
| SHARYN BIRES | Board Member | — | ||
| BUNNY LADEN | Board Member | — | ||
| VINCENT SUNZERI | Board Member | — | ||
| AHMAD THOMAS | Board Member | — | ||
| SCOTT YOKIM | Board Member | — |
Tax year 2023
| Name | Title | Phone | Compensation | |
|---|---|---|---|---|
| ANDREW BALES | Board Member | 6.3% of Rev | ||
| RICHARD CONNIFF | Board President | — | ||
| NANCY JOHNSON | Secretary | — | ||
| LAURIE HUTH | Treasurer | — | ||
| BUNNY LADEN | Treasurer | — | ||
| NICHOLAS ADAMS | Board Member | — | ||
| SHARYN BIRES | Board Member | — | ||
| ASHLEY BRUNI | Board Member | — | ||
| JASON FORD | Board Member | — | ||
| LLOYD SCHMIDT | Board Member | — | ||
| SARALYN WINSLOW | Board Member | — |
Tax year 2022
| Name | Title | Phone | Compensation | |
|---|---|---|---|---|
| ANDREW BALES | Board Member | 6.3% of Rev | ||
| JENNIFER WATKINS | GENERAL MANAGER | 4.2% of Rev | ||
| RICHARD CONNIFF | Board President | — | ||
| NANCY JOHNSON | Secretary | — | ||
| LAURIE HUTH | Treasurer | — | ||
| NICHOLAS ADAMS | Board Member | — | ||
| JASON FORD | Board Member | — | ||
| ASHLEY BRUNI | Board Member | — | ||
| LLOYD SCHMIDT | Board Member | — | ||
| BUNNY LADEN | Board Member | — | ||
| MARIANNE SALAS | Board Member | — |
Tax year 2021
| Name | Title | Phone | Compensation | |
|---|---|---|---|---|
| ANDREW BALES | Board Member | 6.8% of Rev | ||
| JENNIFER WATKINS | GENERAL MANAGER | 4.5% of Rev | ||
| RICHARD CONNIFF | Board President | — | ||
| NANCY JOHNSON | Secretary | — | ||
| LAURIE HUTH | Treasurer | — | ||
| NICHOLAS ADAMS | Board Member | — | ||
| MARIANNE SALAS | Board Member | — | ||
| ROBERT KIEVE | Board Member | — | ||
| MARC MCGEEVER | Board Member | — | ||
| JASON FORD | Board Member | — | ||
| LLOYD SCHMIDT | Board Member | — | ||
| BUNNY LADEN | Board Member | — |
Score breakdown
The three components combine into a single 0–100 score weighted as shown. Full methodology →
Peer comparison
Compared to 1,424 other orgs in CA with NTEE prefix A6.
Most-divergent component: financial score sits 38 points below the peer median (15 vs. 53).
5-year trend: Acute Resource Divergence
Revenue is contracting significantly, but executive compensation percentage is rising. The organization is refusing to adjust its administrative overhead to match its new economic reality.
What's driving this score
- Comp-to-revenue ratio of 11.7% sits within the sector's healthy band (18–22%).
- Financial resilience score in the bottom quartile — reserves and liabilities ratios warrant review.
What would change this score
The two changes that would most improve this score:
- Build cash reserves to at least 3 months of operating expenses — moves financial resilience score meaningfully (~10 points).
Improving governance is a board decision. These are the levers.