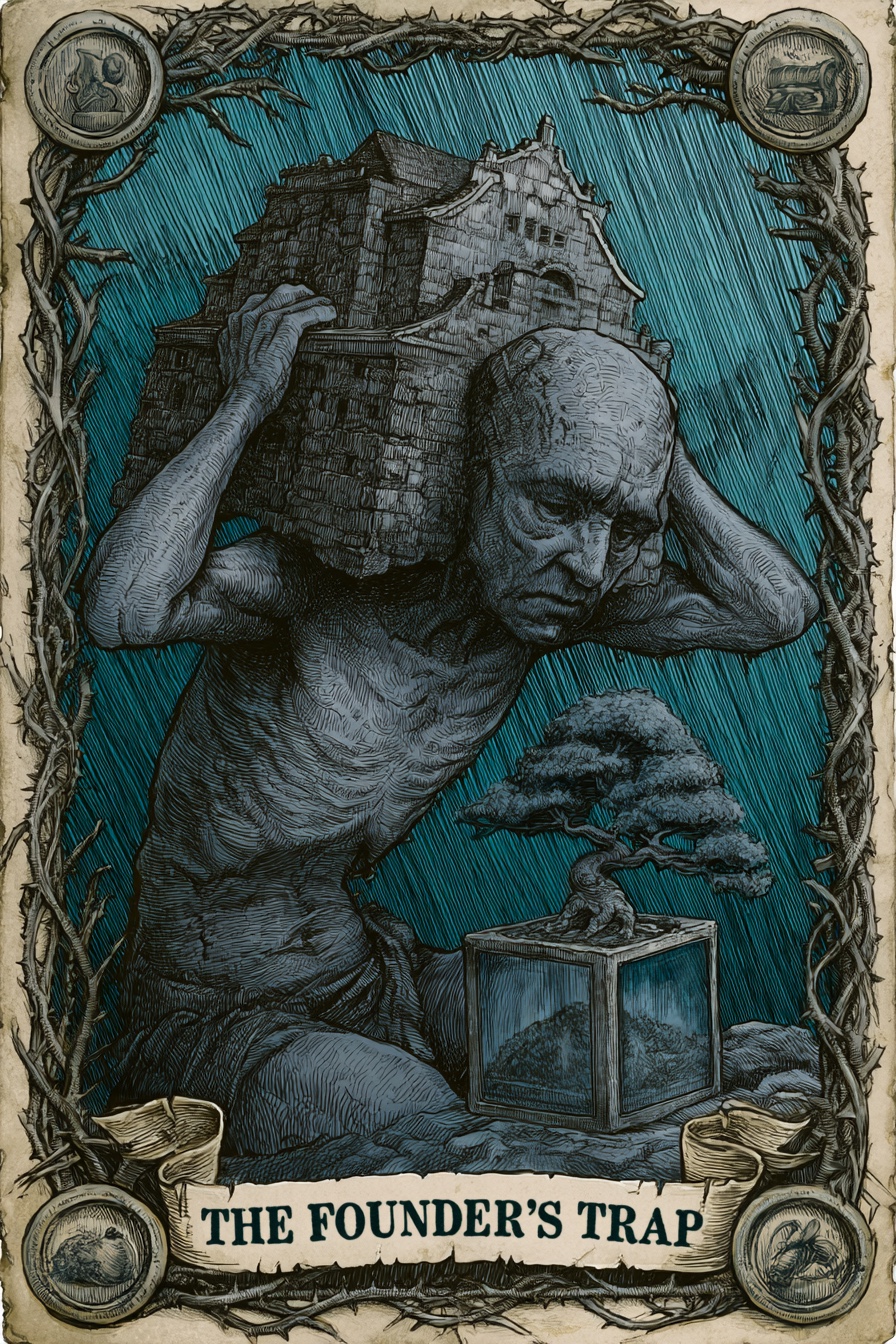
The Founder's Trap
What does this mean?
10-year flat revenue, below-market executive comp, and a small board. The organization survives purely on the sweat equity of a founder, making it utterly un-transferable.
The Path Forward
The Dispersal
Forces succession planning and structural maturity. It requires raising capacity-building funds to decouple the organization's survival from the founder's personal sacrifice.
Title
Representative Institutions
Institutional Epochs
Historical Performance
| Year | Revenue | Top Comp | Comp % Rev | Score | Phase Label | Outlook | Details |
|---|---|---|---|---|---|---|---|
| 2024 | Hidden | Hidden | — | — | Unknown | — | |
| 2023 | — | — | 2.5% | 37 | Financially Distressed | Decline Risk | |
| 2022 | — | — | 2.6% | 49 | Fragile | Stable Watch | |
| 2021 | — | — | 2.9% | 49 | Fragile | Recovery | |
| 2020 | — | — | 5.7% | 44 | Financially Distressed | Recovery | |
| 2019 | — | — | 3.0% | 41 | Fragile | Stable Watch | |
| 2018 | — | — | 3.4% | 41 | Fragile | Stable Watch | |
| 2017 | — | — | 3.2% | 41 | Fragile | Recovery | |
| 2016 | — | — | 3.7% | 35 | Financially Distressed | Stable Watch | |
| 2015 | — | — | 3.8% | 35 | Financially Distressed | Recovery | |
| 2014 | — | — | 3.9% | 34 | Critical Intervention Needed | Stable Watch | |
| 2013 | — | — | 4.1% | 35 | Financially Distressed | Stable Watch | |
| 2012 | — | — | 2.4% | 35 | Financially Distressed | Recovery | |
| 2011 | — | — | — | 32 | Critical Intervention Needed | Recovery | |
| 2010 | — | — | — | 18 | Critical Intervention Needed | Stable Watch |
Officer compensation history
Tax year 2025
| Name | Title | Phone | Compensation | |
|---|---|---|---|---|
| DANIEL INKLEY | EXECUTIVE DIR. | 3.7% of Rev | ||
| JASON BURNINGHAM | Board Member | — | ||
| FRED HALE | Board Member | — | ||
| STERLING JENSON | Board Member | — | ||
| DAN LILJENQUIST | Board Member | — | ||
| CLARK WILKINSON | Board Member | — | ||
| JOHN REDD | Board Member | — | ||
| PAUL CUTLER | Board Member | — | ||
| SHAWN BEUS | Board Member | — | ||
| KENDALYN HARRIS | Board Member | — | ||
| JAMES AHLSTROM | CHAIRMAN | — | ||
| MICHELLE FALK | Board Member | — | ||
| TAMI FILLMORE | Board Member | — | ||
| CRIS HOGAN | Board Member | — | ||
| JEN LALLI | Board Member | — | ||
| CLAY MONROE | Board Member | — | ||
| JR MOORE | VICE CHAIRMAN | — | ||
| STEVE TERRY | Board Member | — | ||
| STEVE FORSYTH | Board Member | — | ||
| LEE WRIGHT | Board Member | — | ||
| TYLER HANSON | Board Member | — | ||
| KRISTIN HODSON | Board Member | — | ||
| PAUL LILJENQUIST | Board Member | — |
Tax year 2023
| Name | Title | Phone | Compensation | |
|---|---|---|---|---|
| JANSEN DAVIS | EXECUTIVE DIR. | 2.9% of Rev | ||
| JASON BURNINGHAM | Board Member | — | ||
| FRED HALE | Board Member | — | ||
| STERLING JENSON | CHAIRMAN | — | ||
| DAN LILJENQUIST | Board Member | — | ||
| CLARK WILKINSON | Board Member | — | ||
| CATHLEEN GILBERT | Board Member | — | ||
| JOHN REDD | Board Member | — | ||
| PAUL CUTLER | Board Member | — | ||
| KENNETH CUTLER | Board Member | — | ||
| SHAWN BEUS | Board Member | — | ||
| KENDALYN HARRIS | Board Member | — | ||
| JAMES AHLSTROM | VICE CHAIRMAN | — | ||
| MICHELLE FALK | Board Member | — | ||
| TAMI FILLMORE | Board Member | — | ||
| CRIS HOGAN | Board Member | — | ||
| JEN LALLI | Board Member | — | ||
| CLAY MONROE | Board Member | — | ||
| JR MOORE | Board Member | — | ||
| STEVE TERRY | Board Member | — |
Tax year 2021
| Name | Title | Phone | Compensation | |
|---|---|---|---|---|
| JANSEN DAVIS | Executive Dir. | 2.6% of Rev | ||
| JASON BURNINGHAM | Board Member | — | ||
| FRED HALE | Board Member | — | ||
| STERLING JENSON | Vice Chairman | — | ||
| LOWELL LEISHMAN | Board Member | — | ||
| DAN LILJENQUIST | Board Member | — | ||
| CLARK WILKINSON | Board Member | — | ||
| CATHLEEN GILBERT | Board Member | — | ||
| JOHN REDD | Board Member | — | ||
| LEE WRIGHT | Board Member | — | ||
| PAUL CUTLER | Chairman | — | ||
| GAYLA GALLACHER | Board Member | — | ||
| KENNETH CUTLER | Board Member | — | ||
| SHAWN BEUS | Board Member | — | ||
| KENDALYN HARRIS | Board Member | — | ||
| KRISTY WOODWARD | Treasurer | — |
Score breakdown
The three components combine into a single 0–100 score weighted as shown. Full methodology →
Peer comparison
Compared to 114 other orgs in UT with NTEE prefix A6.
Most-divergent component: financial score sits 41 points below the peer median (5 vs. 46).
5-year trend: The Founder's Trap
10-year flat revenue, below-market executive comp, and a small board. The organization survives purely on the sweat equity of a founder, making it utterly un-transferable.
What's driving this score
- Comp-to-revenue ratio of 2.5% sits within the sector's healthy band (18–22%).
- Financial resilience score in the bottom quartile — reserves and liabilities ratios warrant review.
What would change this score
The two changes that would most improve this score:
- Build cash reserves to at least 3 months of operating expenses — moves financial resilience score meaningfully (~10 points).
Improving governance is a board decision. These are the levers.