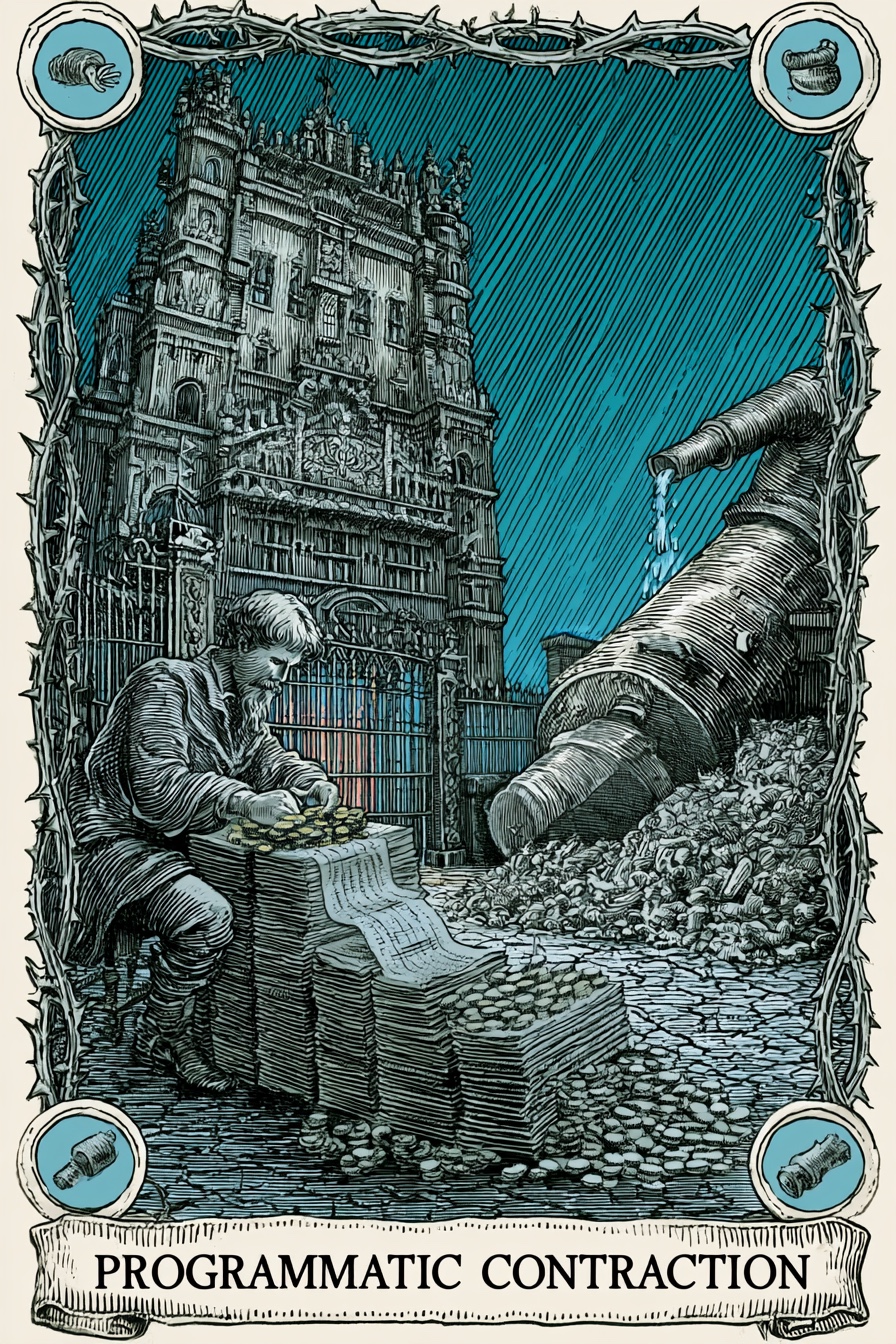
Programmatic Contraction
What does this mean?
Total revenue is stable, but the percentage of expenses spent on actual mission shrinks. Indicates administrative bloat and spending on the machinery of raising money rather than the art itself.
The Path Forward
The Rainmaker
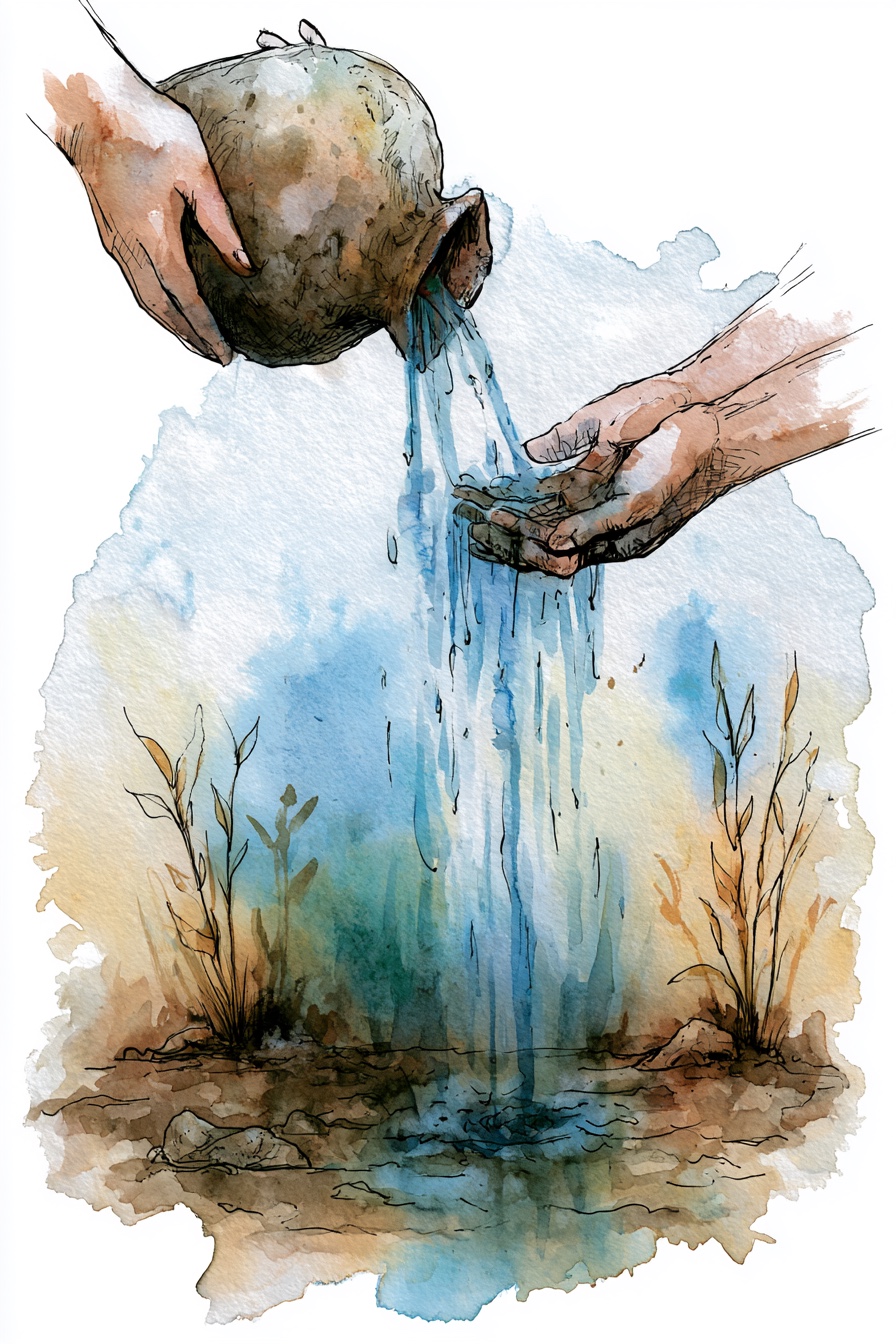
Represents the forced release of hoarded resources back into the community. It acts as a pressure valve against administrative capture, ensuring the mission takes priority over the machine.
Title
Representative Institutions
Institutional Epochs
Historical Performance
| Year | Revenue | Top Comp | Comp % Rev | Score | Phase Label | Outlook | Details |
|---|---|---|---|---|---|---|---|
| 2025 | Hidden | Hidden | — | — | Unknown | — | |
| 2023 | Hidden | Hidden | — | 31 | Critical Intervention Needed | Decline Risk | |
| 2022 | — | — | — | 41 | Fragile | Recovery | |
| 2021 | — | — | 12.0% | 31 | Critical Intervention Needed | Recovery | |
| 2020 | — | — | 9.7% | 30 | Critical Intervention Needed | Stable Watch | |
| 2019 | — | — | 6.4% | 30 | Critical Intervention Needed | Recovery | |
| 2018 | — | — | 12.3% | 29 | Critical Intervention Needed | Stable Watch | |
| 2017 | — | — | — | 29 | Critical Intervention Needed | Stable Watch | |
| 2016 | — | — | — | 29 | Critical Intervention Needed | Stable Watch | |
| 2015 | — | — | — | 29 | Critical Intervention Needed | Stable Watch | |
| 2014 | — | — | — | 29 | Critical Intervention Needed | Stable Watch | |
| 2013 | — | — | — | 29 | Critical Intervention Needed | Stable Watch | |
| 2012 | — | — | — | 29 | Critical Intervention Needed | Stable Watch | |
| 2011 | — | — | — | 25 | Critical Intervention Needed | Stable Watch |
Officer compensation history
Tax year 2025
| Name | Title | Phone | Compensation | |
|---|---|---|---|---|
| BARBARA HOOPENGARDNER | Treasurer | 9.9% of Rev | ||
| KENNETH WOMACK PHD | Board President | — | ||
| JUDITH G LEONE | Board President | — | ||
| KENNETH MALAGIERE | Treasurer | — | ||
| FRANK HUGHES | Board Member | — | ||
| ROSALIE HARVEY | Board Member | — |
Tax year 2023
| Name | Title | Phone | Compensation | |
|---|---|---|---|---|
| BARBARA HOOPENGARDNER | Treasurer | 24.5% of Rev | ||
| KAREN PORCELLO | Board Member | — | ||
| LAUREN M DOOLEY ESQ | Board Member | — | ||
| NANCY MEZEY PHD | Board President | — | ||
| LYNDA E RABENS | Secretary | — | ||
| KENNETH WOMACK PHD | Board President | — | ||
| JUDITH G LEONE | Board Member | — | ||
| ESTELLE WEBMAN BRODKEY | Board Member | — | ||
| JAMES BUFFUM | Board Member | — | ||
| KENNETH MALAGIERE | Board Member | — | ||
| KAREN DIEHL | Treasurer | — | ||
| ANN MARIE BAKER | Board Member | — | ||
| ROSALIE HARVEY | Board Member | — |
Tax year 2022
| Name | Title | Phone | Compensation | |
|---|---|---|---|---|
| BARBARA HOOPENGARDNER | Treasurer | 27.8% of Rev | ||
| GABRIELLA HEIZLER | EXECUTIVE DIREC | 12.2% of Rev | ||
| KAREN PORCELLO | Board Member | — | ||
| LAUREN M DOOLEY ESQ | Board Member | — | ||
| NANCY MEZEY PHD | Board President | — | ||
| LYNDA E RABENS | Secretary | — | ||
| KEN WOMACK | Board President | — | ||
| JUDITH G LEONE | Board Member | — | ||
| ESTELLE BRODKEY | Board Member | — | ||
| RITA KEARNEY | Board Member | — | ||
| JAMES BUFFUM | Board Member | — | ||
| KENNETH MALAGIERE | Board Member | — | ||
| RENEE LOMELL | Board Member | — | ||
| KAREN DIEHL | Treasurer | — | ||
| ANN MARIE BAKER | Board Member | — | ||
| ROSALIE HARVEY | Board Member | — | ||
| LINDA ABRAMSON | Board Member | — |
Tax year 2021
| Name | Title | Phone | Compensation | |
|---|---|---|---|---|
| BARBARA HOOPENGARDNER | Treasurer | 29.3% of Rev | ||
| GABRIELLA HEIZLER | Executive Dir. | 2.0% of Rev | ||
| KAREN PORCELLO | Board Member | — | ||
| LAUREN M DOOLEY ESQ | Board President | — | ||
| NANCY MEZEY PHD | Board President | — | ||
| LYNDA E RABENS | Secretary | — | ||
| KEN WOMACK | Board President | — | ||
| JUDITH G LEONE | Board Member | — | ||
| ESTELLE BRODKEY | Board Member | — | ||
| RITA KEARNEY | Board Member | — | ||
| JAMES BUFFUM | Board Member | — | ||
| KENNETH MALAGIERE | Board Member | — | ||
| RENEE LOMELL | Board Member | — | ||
| KAREN DIEHL | Treasurer | — | ||
| ANN MARIE BAKER | Board Member | — | ||
| ROSALIE HARVEY | Board Member | — | ||
| LINDA ABRAMSON | Board Member | — |
Score breakdown
The three components combine into a single 0–100 score weighted as shown. Full methodology →
Peer comparison
Compared to 250 other orgs in NJ with NTEE prefix A6.
Most-divergent component: program score sits 21 points below the peer median (5 vs. 26).
5-year trend: Programmatic Contraction
Total revenue is stable, but the percentage of expenses spent on actual mission shrinks. Indicates administrative bloat and spending on the machinery of raising money rather than the art itself.
What's driving this score
- Financial resilience score in the bottom quartile — reserves and liabilities ratios warrant review.
What would change this score
The two changes that would most improve this score:
- Build cash reserves to at least 3 months of operating expenses — moves financial resilience score meaningfully (~10 points).
Improving governance is a board decision. These are the levers.