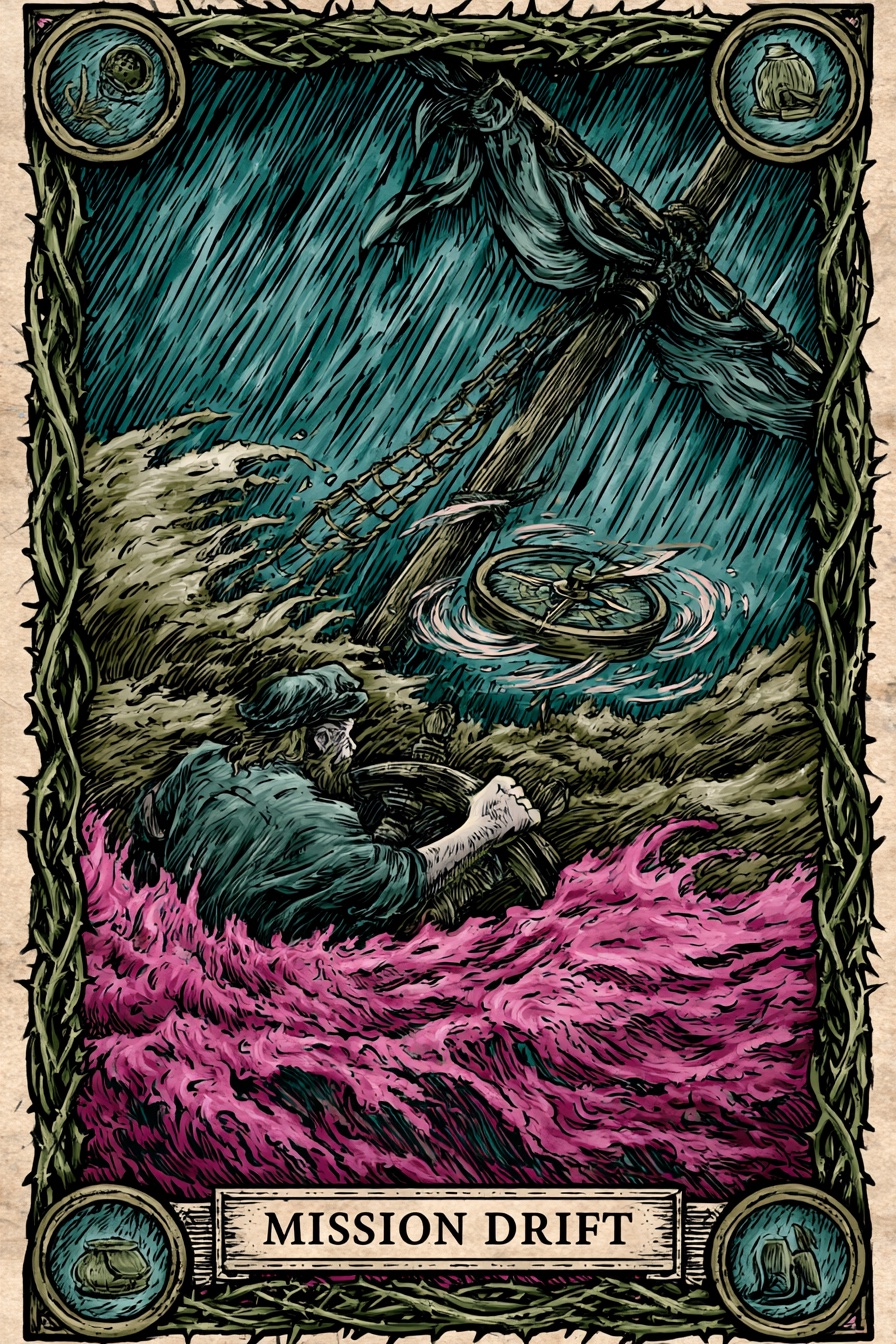
Mission Drift
What does this mean?
Highly volatile revenue swings year over year paired with fluctuating Program Scores. The organization is constantly pivoting to chase restricted grant funding rather than building a sustainable core.
The Path Forward
The Lodestar
A radical recommitment to the core mission. It requires the organization to gain the strength to say 'no' to restricted funding that pulls them away from their true purpose.
Title
Representative Institutions
Institutional Epochs
Historical Performance
| Year | Revenue | Top Comp | Comp % Rev | Score | Phase Label | Outlook | Details |
|---|---|---|---|---|---|---|---|
| 2024 | Hidden | Hidden | 3.9% | 55 | Fragile | Recovery | |
| 2023 | — | — | 25.8% | 42 | Governance-Stressed | Recovery | |
| 2022 | — | — | 62.7% | 30 | Critical Intervention Needed | Gov Risk | |
| 2021 | — | — | 12.3% | 45 | Fragile | Recovery | |
| 2020 | — | — | 22.5% | 42 | Governance-Stressed | Recovery | |
| 2019 | — | — | 40.3% | 37 | Governance-Stressed | Gov Risk | |
| 2018 | — | — | 41.5% | 33 | Critical Intervention Needed | Recovery | |
| 2017 | — | — | 42.4% | 31 | Critical Intervention Needed | Gov Risk | |
| 2016 | — | — | 67.0% | 27 | Critical Intervention Needed | Gov Risk | |
| 2015 | — | — | 56.8% | 27 | Critical Intervention Needed | Gov Risk | |
| 2014 | — | — | 33.8% | 31 | Critical Intervention Needed | Gov Risk | |
| 2013 | — | — | 30.1% | 31 | Critical Intervention Needed | Gov Risk | |
| 2012 | — | — | 39.3% | 38 | Governance-Stressed | Gov Risk | |
| 2011 | — | — | 10.1% | 45 | Fragile | Stable Watch |
Officer compensation history
Tax year 2025
| Name | Title | Phone | Compensation | |
|---|---|---|---|---|
| Dianne Stengel | Operations Mgr | 2.7% of Rev | ||
| William Hunt | Concertmaster | 1.1% of Rev | ||
| Michael Quinn | Board Member | — | ||
| Virginia Mills | Orchestra Representative | — | ||
| Alan Lowne | Board President | — | ||
| Carol Lowne | Board President | — | ||
| Beverly Voos | Board Member | — | ||
| Ben Martin | Board Member | — | ||
| Yvonne Adams | Board Member | — | ||
| Laurie Kennedy | Board Member | — | ||
| Steve Landgren | Board Member | — | ||
| Harrison Hartsough | Board Member | — | ||
| David Mear | Treasurer | — |
Tax year 2023
| Name | Title | Phone | Compensation | |
|---|---|---|---|---|
| David Harman | Board Member | 1.1% of Rev | ||
| Dianne Stengel | Operations Mgr | 1.1% of Rev | ||
| William Hunt | Concertmaster | 0.5% of Rev | ||
| Jeanne Gray | Board Member | — | ||
| David Mear | Treasurer | — | ||
| Michael Quinn | Board Member | — | ||
| Helen Zimmerman | Orchestra Representative | — | ||
| Alan Lowne | Board President | — | ||
| Carol Lowne | Board President | — | ||
| Beverly Voos | Board Member | — | ||
| Nicole Ozinkowski | Board Member | — | ||
| Ben Martin | Board Member | — | ||
| Yvonne Adams | Board Member | — | ||
| Sue Brown | Board Member | — | ||
| Virginia Mills | Orchestra Representative | — |
Tax year 2022
| Name | Title | Phone | Compensation | |
|---|---|---|---|---|
| Dianne Stengel | Operations Mgr | 2.4% of Rev | ||
| David Harman | Board Member | 1.0% of Rev | ||
| William Hunt | Concertmaster | 0.4% of Rev | ||
| Jeanne Gray | Board Member | — | ||
| David Mear | Treasurer | — | ||
| Michael Quinn | Board Member | — | ||
| Helen Zimmerman | Orchestra Representative | — | ||
| Alan Lowne | Board President | — | ||
| Carol Lowne | Board President | — | ||
| Beverly Voos | Board Member | — | ||
| Nicole Ozinkowski | Board Member | — | ||
| Peggy Hall | Board Member | — | ||
| Yvonne Adams | Board Member | — | ||
| Sue Brown | Board Member | — | ||
| Virginia Mills | Board Member | — |
Tax year 2021
| Name | Title | Phone | Compensation | |
|---|---|---|---|---|
| Dianne Stengel | Operations Mgr | 3.6% of Rev | ||
| David Harman | Board Member | 1.8% of Rev | ||
| William Hunt | Concertmaster | 0.8% of Rev | ||
| Jeanne Gray | Board Member | — | ||
| David Mear | Treasurer | — | ||
| Michael Quinn | Board Member | — | ||
| Helen Zimmerman | Orchestra Representative | — | ||
| Alan Lowne | Board President | — | ||
| Carol Lowne | Board President | — | ||
| Beverly Voos | Board Member | — | ||
| Julia Figueras | Board Member | — | ||
| Nicole Ozinkowski | Board Member | — | ||
| Peggy Hall | Board Member | — | ||
| Yvonne Adams | Board Member | — | ||
| Sue Brown | Board Member | — | ||
| Virginia Mills | Board Member | — |
Score breakdown
The three components combine into a single 0–100 score weighted as shown. Full methodology →
Peer comparison
Compared to 1,227 other orgs in NY with NTEE prefix A6.
Most-divergent component: program score sits 31 points above the peer median (60 vs. 29).
5-year trend: Mission Drift
Highly volatile revenue swings year over year paired with fluctuating Program Scores. The organization is constantly pivoting to chase restricted grant funding rather than building a sustainable core.
Overall score has gone from 42 → 55 over 5 years (improving by 13 points). A multi-year directional move of this magnitude is a signal worth investigating.
What's driving this score
- Comp-to-revenue ratio of 3.9% sits within the sector's healthy band (18–22%).
- Two consecutive years of deficit spending.
What would change this score
The two changes that would most improve this score:
- Stabilize program expenses or grow earned-income revenue to break the consecutive-deficit pattern (~8 points to financial score).
Improving governance is a board decision. These are the levers.