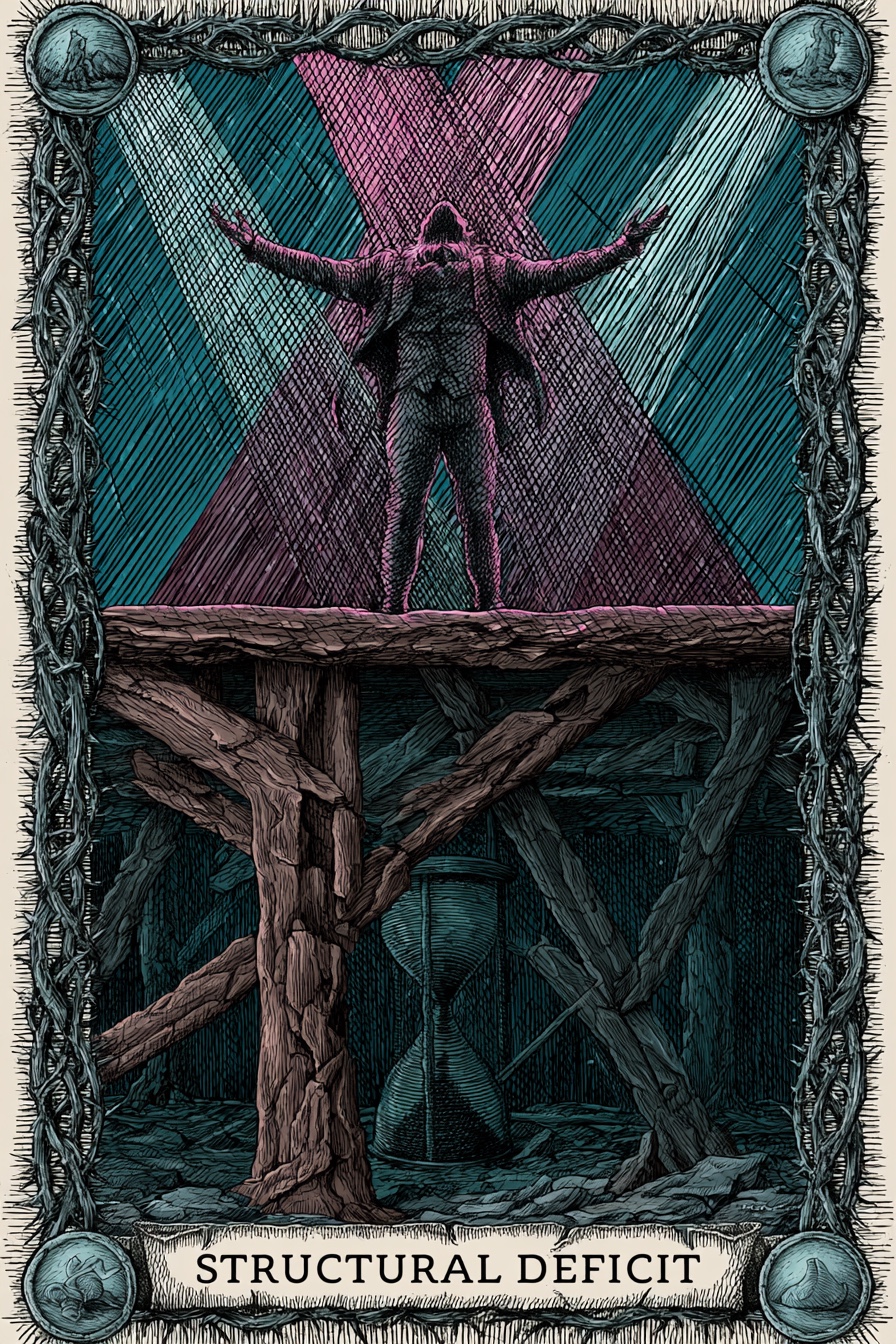
Structural Deficit
What does this mean?
Persistently low financial health over 5 years despite strong programmatic output. They are borrowing from their future (or bleeding an endowment) to pay for today's programs.
The Path Forward
The Truth-Teller
Forces necessary, painful cuts to preserve the core. It demands that the organization stop borrowing from its future and align its current programmatic output with actual sustainable revenue.
Title
Representative Institutions
Institutional Epochs
Historical Performance
| Year | Revenue | Top Comp | Comp % Rev | Score | Phase Label | Outlook | Details |
|---|---|---|---|---|---|---|---|
| 2024 | Hidden | Hidden | — | — | Unknown | — | |
| 2023 | Hidden | Hidden | — | — | Unknown | — | |
| 2022 | — | — | 20.8% | 29 | Critical Intervention Needed | Decline Risk | |
| 2021 | — | — | 24.4% | 25 | Critical Intervention Needed | Stable Watch | |
| 2020 | — | — | 20.4% | 27 | Critical Intervention Needed | Stable Watch | |
| 2019 | — | — | 12.1% | 29 | Critical Intervention Needed | Decline Risk | |
| 2018 | — | — | 13.9% | 29 | Critical Intervention Needed | Stable Watch | |
| 2017 | — | — | 14.5% | 29 | Critical Intervention Needed | Stable Watch | |
| 2016 | — | — | 10.3% | 32 | Critical Intervention Needed | Recovery | |
| 2015 | — | — | 17.1% | 27 | Critical Intervention Needed | Decline Risk | |
| 2014 | — | — | 10.6% | 32 | Critical Intervention Needed | Stable Watch | |
| 2013 | — | — | 10.0% | 29 | Critical Intervention Needed | Recovery | |
| 2012 | — | — | 16.0% | 27 | Critical Intervention Needed | Stable Watch | |
| 2011 | — | — | 15.0% | 27 | Critical Intervention Needed | Stable Watch |
Officer compensation history
Tax year 2026
| Name | Title | Phone | Compensation | |
|---|---|---|---|---|
| KAREN PAISLEY | EXECUTIVE DI | 21.8% of Rev | ||
| BRAD DAWDY | Board President | — | ||
| CLAUDIA GRUNEWALD | VICE PRESIDE | — | ||
| MICHAEL BEAHM | Board Member | — | ||
| PAM SCHNAKE | Board President | — | ||
| STEVE BENNETT | Board Member | — | ||
| ALAN TILSON | Board Member | — | ||
| GREG SMITH | Board Member | — | ||
| DR PARK BUCKER | Board Member | — |
Tax year 2025
| Name | Title | Phone | Compensation | |
|---|---|---|---|---|
| KAREN PAISLEY | EXECUTIVE DI | 20.8% of Rev | ||
| BRAD DAWDY | Board President | — | ||
| CLAUDIA GRUNEWALD | VICE PRESIDE | — | ||
| MICHAEL BEAHM | Board Member | — | ||
| PAM SCHNAKE | Board President | — | ||
| STEVE BENNETT | Board Member | — | ||
| ALAN TILSON | Board Member | — | ||
| GREG SMITH | Board Member | — | ||
| DR PARK BUCKER | Board Member | — |
Tax year 2023
| Name | Title | Phone | Compensation | |
|---|---|---|---|---|
| KAREN PAISLEY | EXECUTIVE DI | 12.3% of Rev | ||
| KAREN PAISLEY | EXECUTIVE DI | 9.4% of Rev | ||
| JOHN R PAISLEY | Board Member | 5.7% of Rev | ||
| JOHN R PAISLEY | Board Member | 5.0% of Rev | ||
| BRAD DAWDY | Board President | — | ||
| SCOTT CROUSE | Board Member | — | ||
| CLAUDIA GRUNEWALD | VICE PRESIDE | — | ||
| MARK CARDER | Board Member | — | ||
| MICHAEL BEAHM | Board Member | — | ||
| THELDA KESTENBAUM | Board Member | — | ||
| PAM SCHNAKE | Board Member | — | ||
| STEVE BENNETT | Board Member | — | ||
| DAVE WALDEN | Board Member | — | ||
| ALAN TILSON | Board Member | — | ||
| BRAD DAWDY | Board President | — | ||
| CLAUDIA GRUNEWALD | VICE PRESIDE | — |
Tax year 2021
| Name | Title | Phone | Compensation | |
|---|---|---|---|---|
| KAREN PAISLEY | Executive Director | 7.1% of Rev | ||
| JOHN R PAISLEY | Board Member | 3.4% of Rev | ||
| SCOTT CROUSE | Board Member | — | ||
| MARK CARDER | Board Member | — | ||
| THELDA KESTENBAUM | Board Member | — | ||
| DAVE WALDEN | Board Member | — | ||
| BRAD DAWDY | Board President | — | ||
| CLAUDIA GRUNEWALD | VICE PRESDIENT | — |
Score breakdown
The three components combine into a single 0–100 score weighted as shown. Full methodology →
Peer comparison
Compared to 160 other orgs in MO with NTEE prefix A6.
Most-divergent component: financial score sits 53 points below the peer median (0 vs. 53).
5-year trend: Structural Deficit
Persistently low financial health over 5 years despite strong programmatic output. They are borrowing from their future (or bleeding an endowment) to pay for today's programs.
What's driving this score
- Comp-to-revenue ratio of 20.8% sits within the sector's healthy band (18–22%).
- Financial resilience score in the bottom quartile — reserves and liabilities ratios warrant review.
What would change this score
The two changes that would most improve this score:
- Separate signing authority from fundraising authority when both are held by one person — removes the concentration penalty (~12 points).
- Build cash reserves to at least 3 months of operating expenses — moves financial resilience score meaningfully (~10 points).
Improving governance is a board decision. These are the levers.